I am attempting to snoop and decode the communication on an I2C bus with the intention of intercepting read/write operations to an EEPROM chip.
I've opted to store the data in RAM and then dump to serial port at the end of the capture period. Most Duemilanoves come with a ATMega 328 chip which has 2KByte of RAM: enough to capture about 500 transitions. Streaming data to the serial port probably won't work as the pins can't be monitored while data is being transmitted on the serial port resulting in missed transitions. [Update: (25 May 2010) This may be possible after all as the ATMega chip has a hardware UART.]
Plotting the data
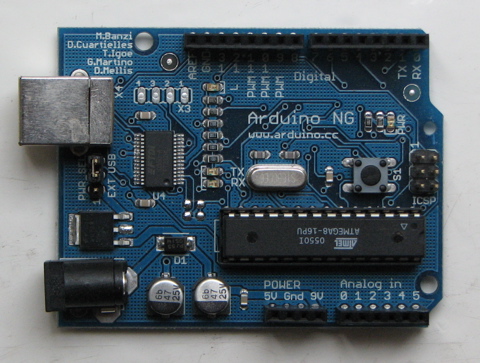
The program will record all pins of the ATMega Port D (Arduino Duemilanove pins 0 to 7). I'm monitoring two lines: the I2C SCL (clock) and SDA (data) where are connected to pins 2 and 3 of the Arduino respectively.
Data output is obtained from the Serial Monitor and looks like this:
42778 0 0 0 0 1 1 0 0
42779 0 0 0 0 1 0 0 0
42789 0 0 0 0 1 0 0 0
42790 0 0 0 0 1 1 0 0
42798 0 0 0 0 1 1 0 0
42799 0 0 0 0 0 1 0 0
42816 0 0 0 0 0 1 0 0
42817 0 0 0 0 0 0 0 0
42861 0 0 0 0 0 0 0 0
42862 0 0 0 0 1 0 0 0
42880 0 0 0 0 1 0 0 0
First column is the time stamp. Subsequent columns are pin 7 to pin 0 state.
Gnuplot is a simple to use plotting package that gets results quickly. Cut/paste the output from the serial monitor into a file (eg la.dat). The following command will port pin 4 (SDA) an pin 3 (SCL). I've multiplied the SCL line by 2 so that the two traces are clearly visible.
plot 'la.dat' using 1:6 with lines, 'la.dat' using 1:($7 * 1.2 - 0.1) with lines;

The Arduino program
#define MAX_TRANS 256

char data[MAX_TRANS];
short data_t[MAX_TRANS];

int dp = 0;

void setup()   {
  DDRD = 0b00000000; // (pins 0 - 7 on Duemilanove) as input
  Serial.begin(115200); // serial port at decent high speed
}

void loop()
{
  dp = 0;
  char d, pd;
  pd = PIND & 0b0001100 ;  // only interested in pins 2,3
  unsigned short t = 0, pt;

  // Poll port in tight loop. Use iteration counter as timer.
  while (dp < MAX_TRANS) {
    t++;
    d = PIND & 0b0001100; // only interested in pins 2,3
    if (d == pd) {
      continue;
    }
    data[dp] = d;
    pd = d;
    data_t[dp] = t - pt;
    pt = t;
    dp++;
  }

  // Write data to serial port
  int i;
  long tt=0;
  for (i = 1; i < dp; i++) {
    tt += data_t[i];
    writeData(tt-1, data[i-1]);
    writeData(tt, data[i]);
  }

}

void writeData (unsigned short t, unsigned char data) {
    Serial.print (t);
    for (int i = 0; i < 8; i++) {
      Serial.print (  (data & 0b10000000) == 0 ? " 0" : " 1");
      data<<=1;
    }
    Serial.println ("");
}
No comments:
Post a Comment